Case Study
Fair Trade Impact Reports
Converting traditional PDF impact reports into engaging, interactive web pages with data visualization and clear communication.
Problem & Context
Traditional PDF impact reports, while comprehensive, suffered from poor engagement and limited accessibility. Stakeholders struggled to understand the organization's impact at a glance, and the dense formatting made it difficult to discover key metrics or compelling stories.
The organization needed to transform these reports into dynamic web experiences that would better communicate their impact, engage stakeholders, and make their mission-driven work immediately clear and compelling.
My Role
I worked as the primary designer and information architect, transforming dense report data into engaging web experiences. My responsibilities included information architecture and content strategy, designing data visualization and infographics, creating interactive web layouts, and ensuring accessibility and engagement across all sections.
Design Concept
Strategic Framework
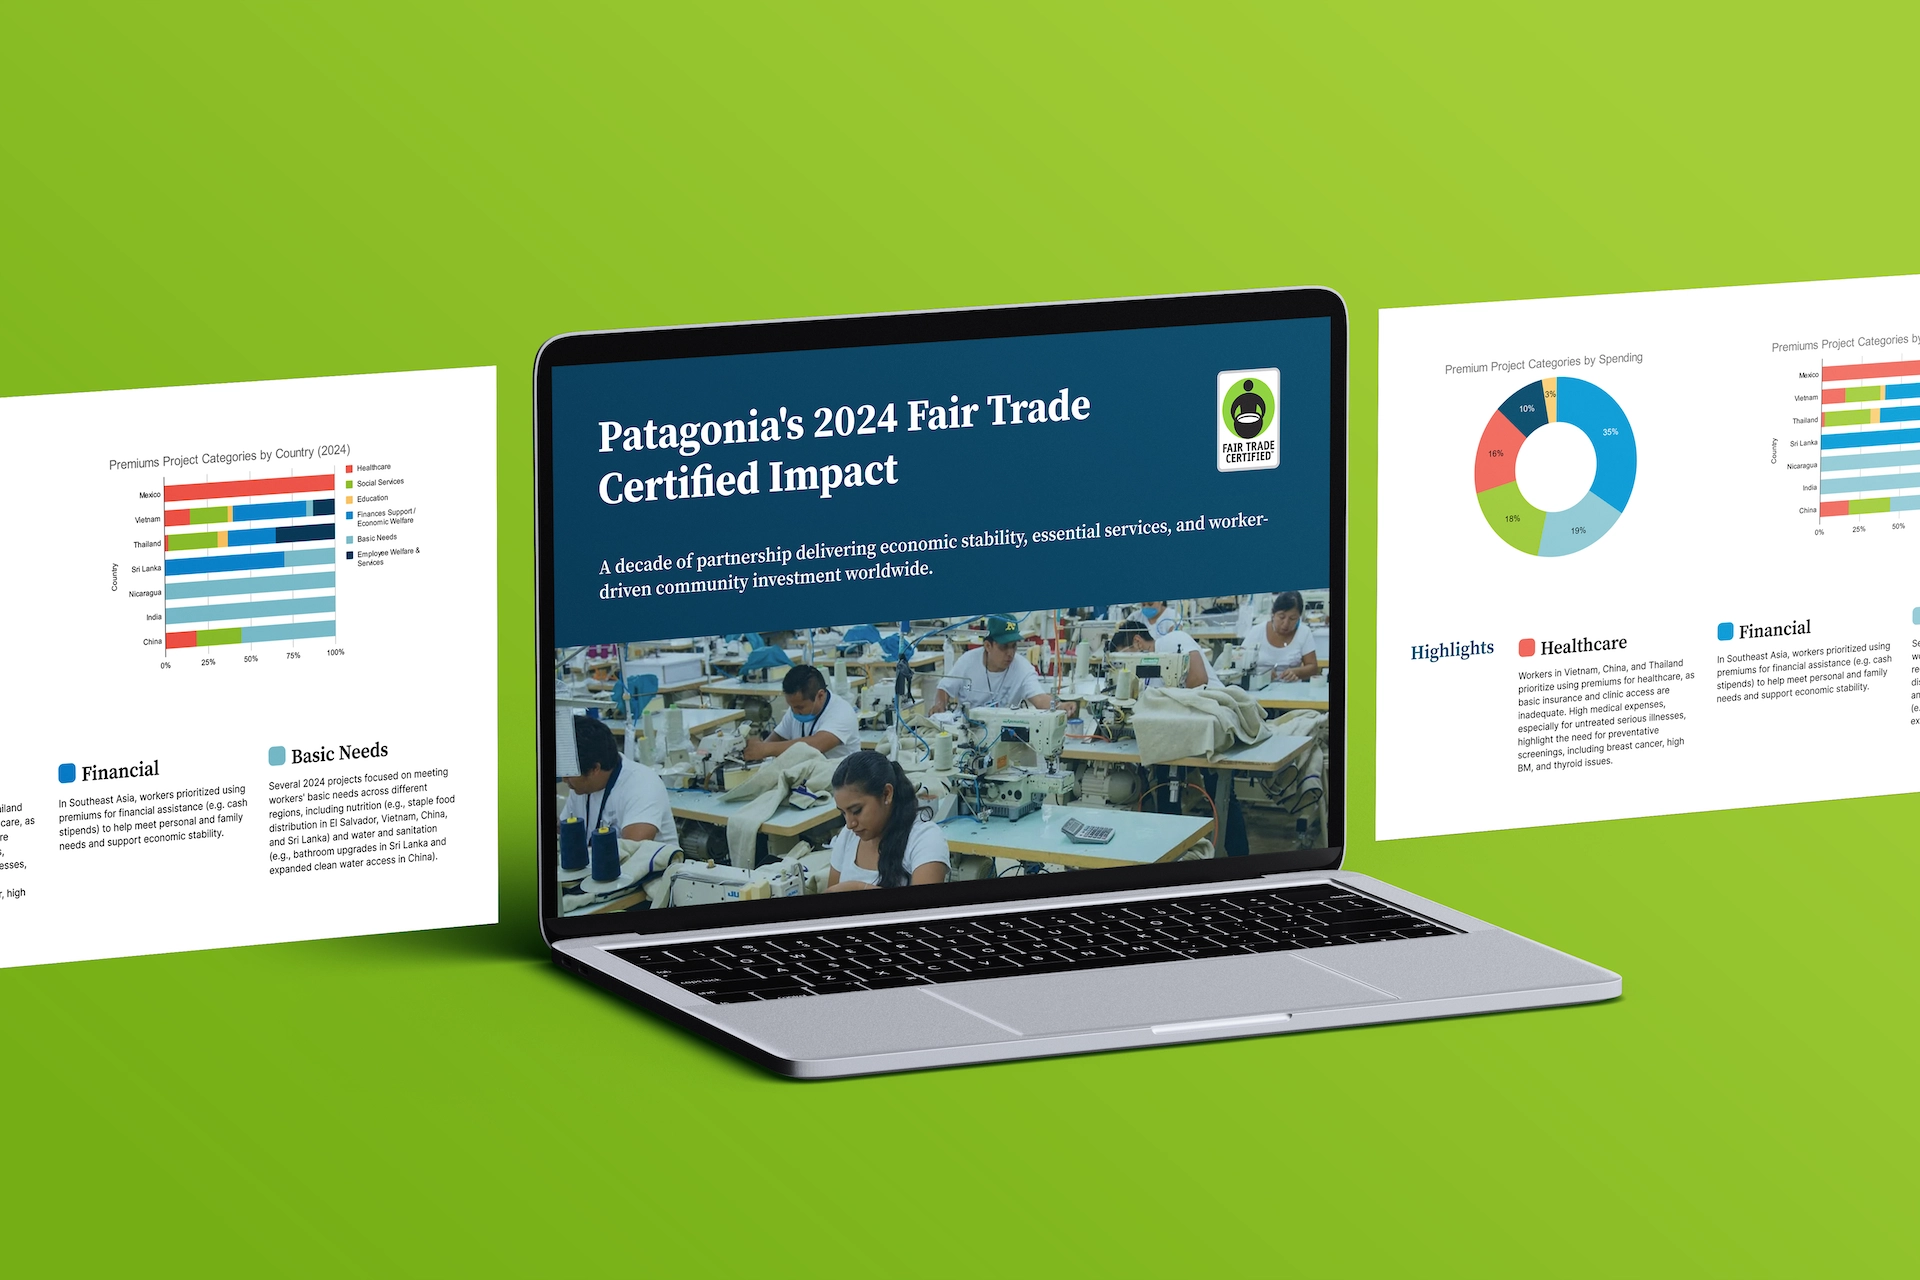
The design approach transformed linear PDF reports into scrollable, narrative-driven web experiences that emphasize impact and storytelling while maintaining data integrity.
Visual data hierarchy — Key impact metrics appear prominently with supporting data available through interactive elements
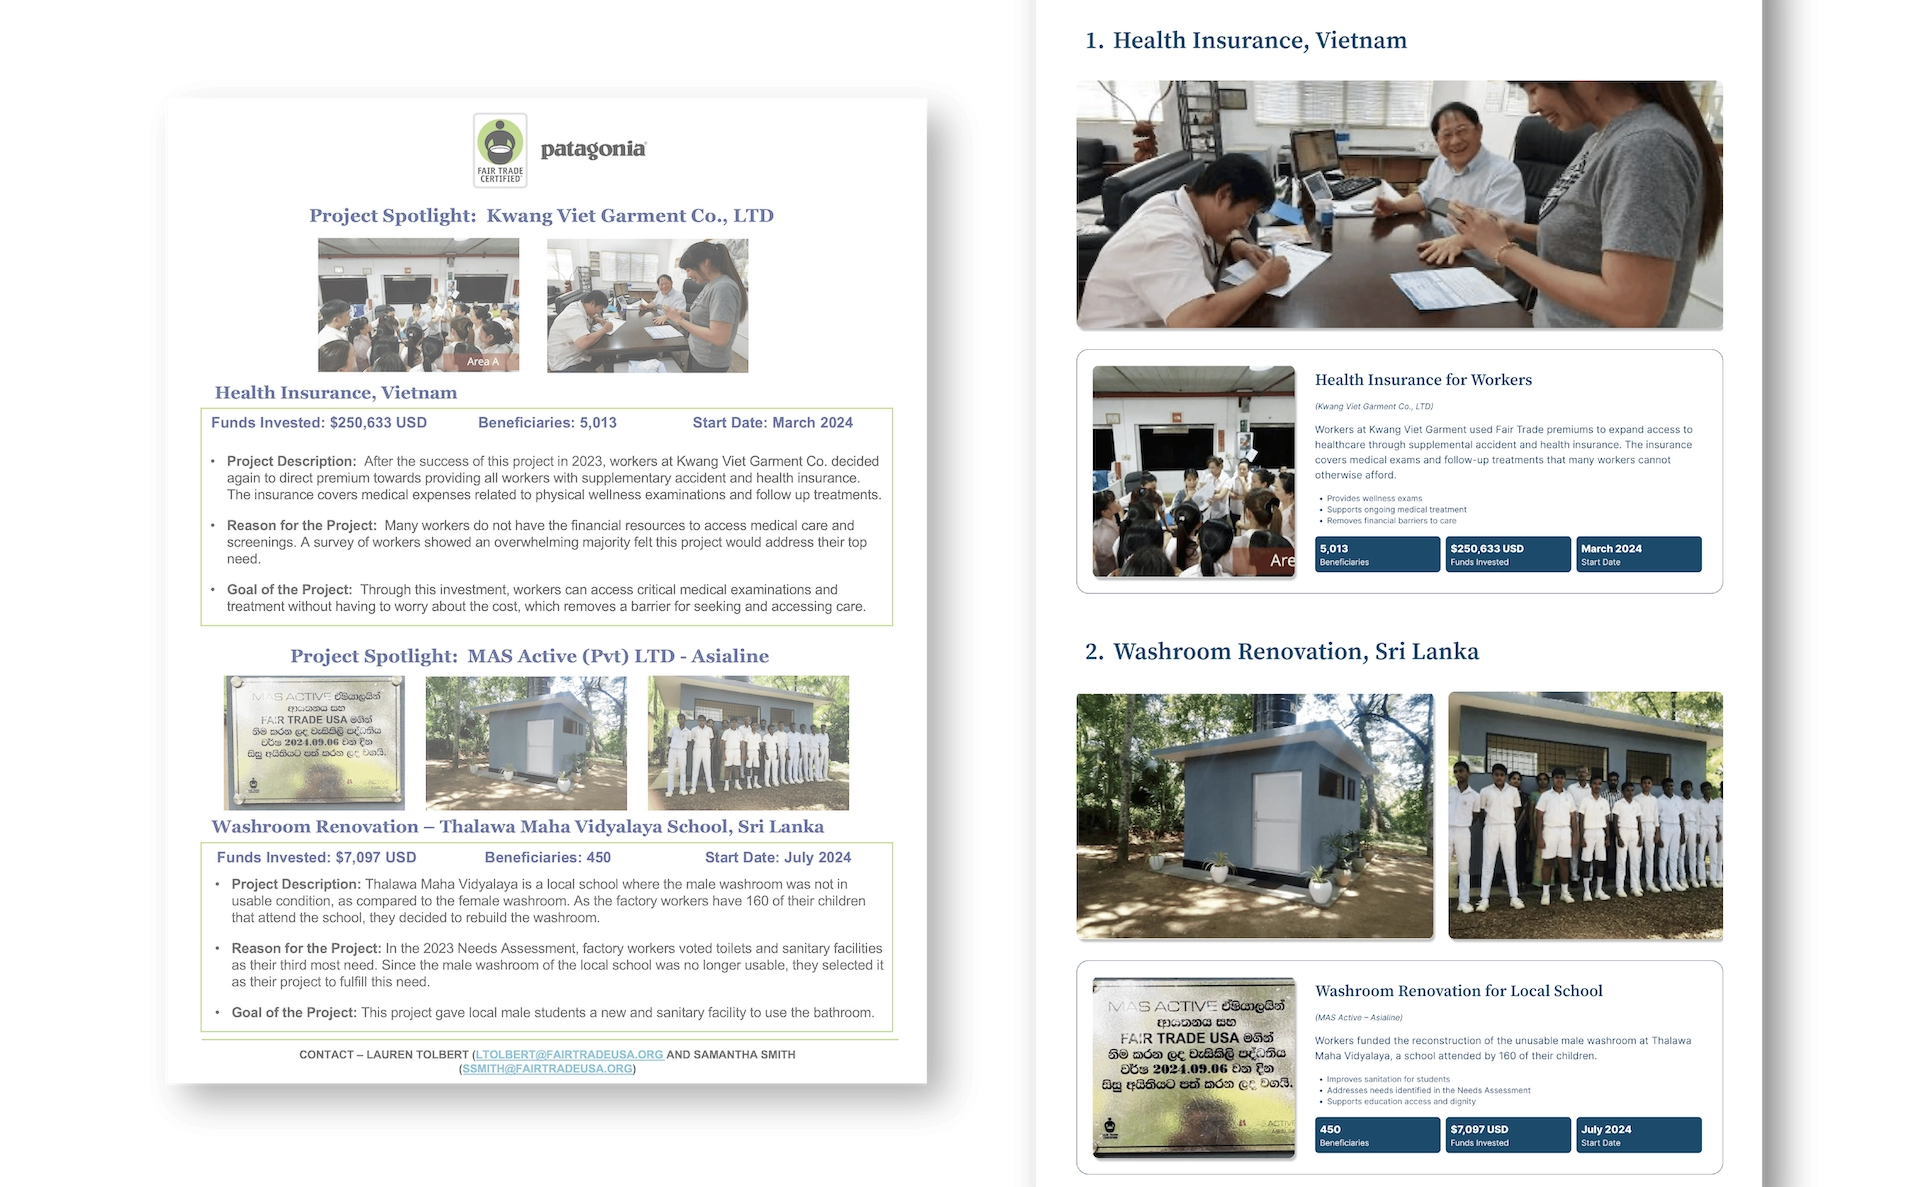
Storytelling through scrolling — Content unfolds in a narrative arc that guides users from mission overview through impact details
Interactive data visualization — Charts and infographics that are engaging, accessible, and aid comprehension of complex data
Modular design — Flexible template that works across different report structures and organizational types
Process
Web Layout Design
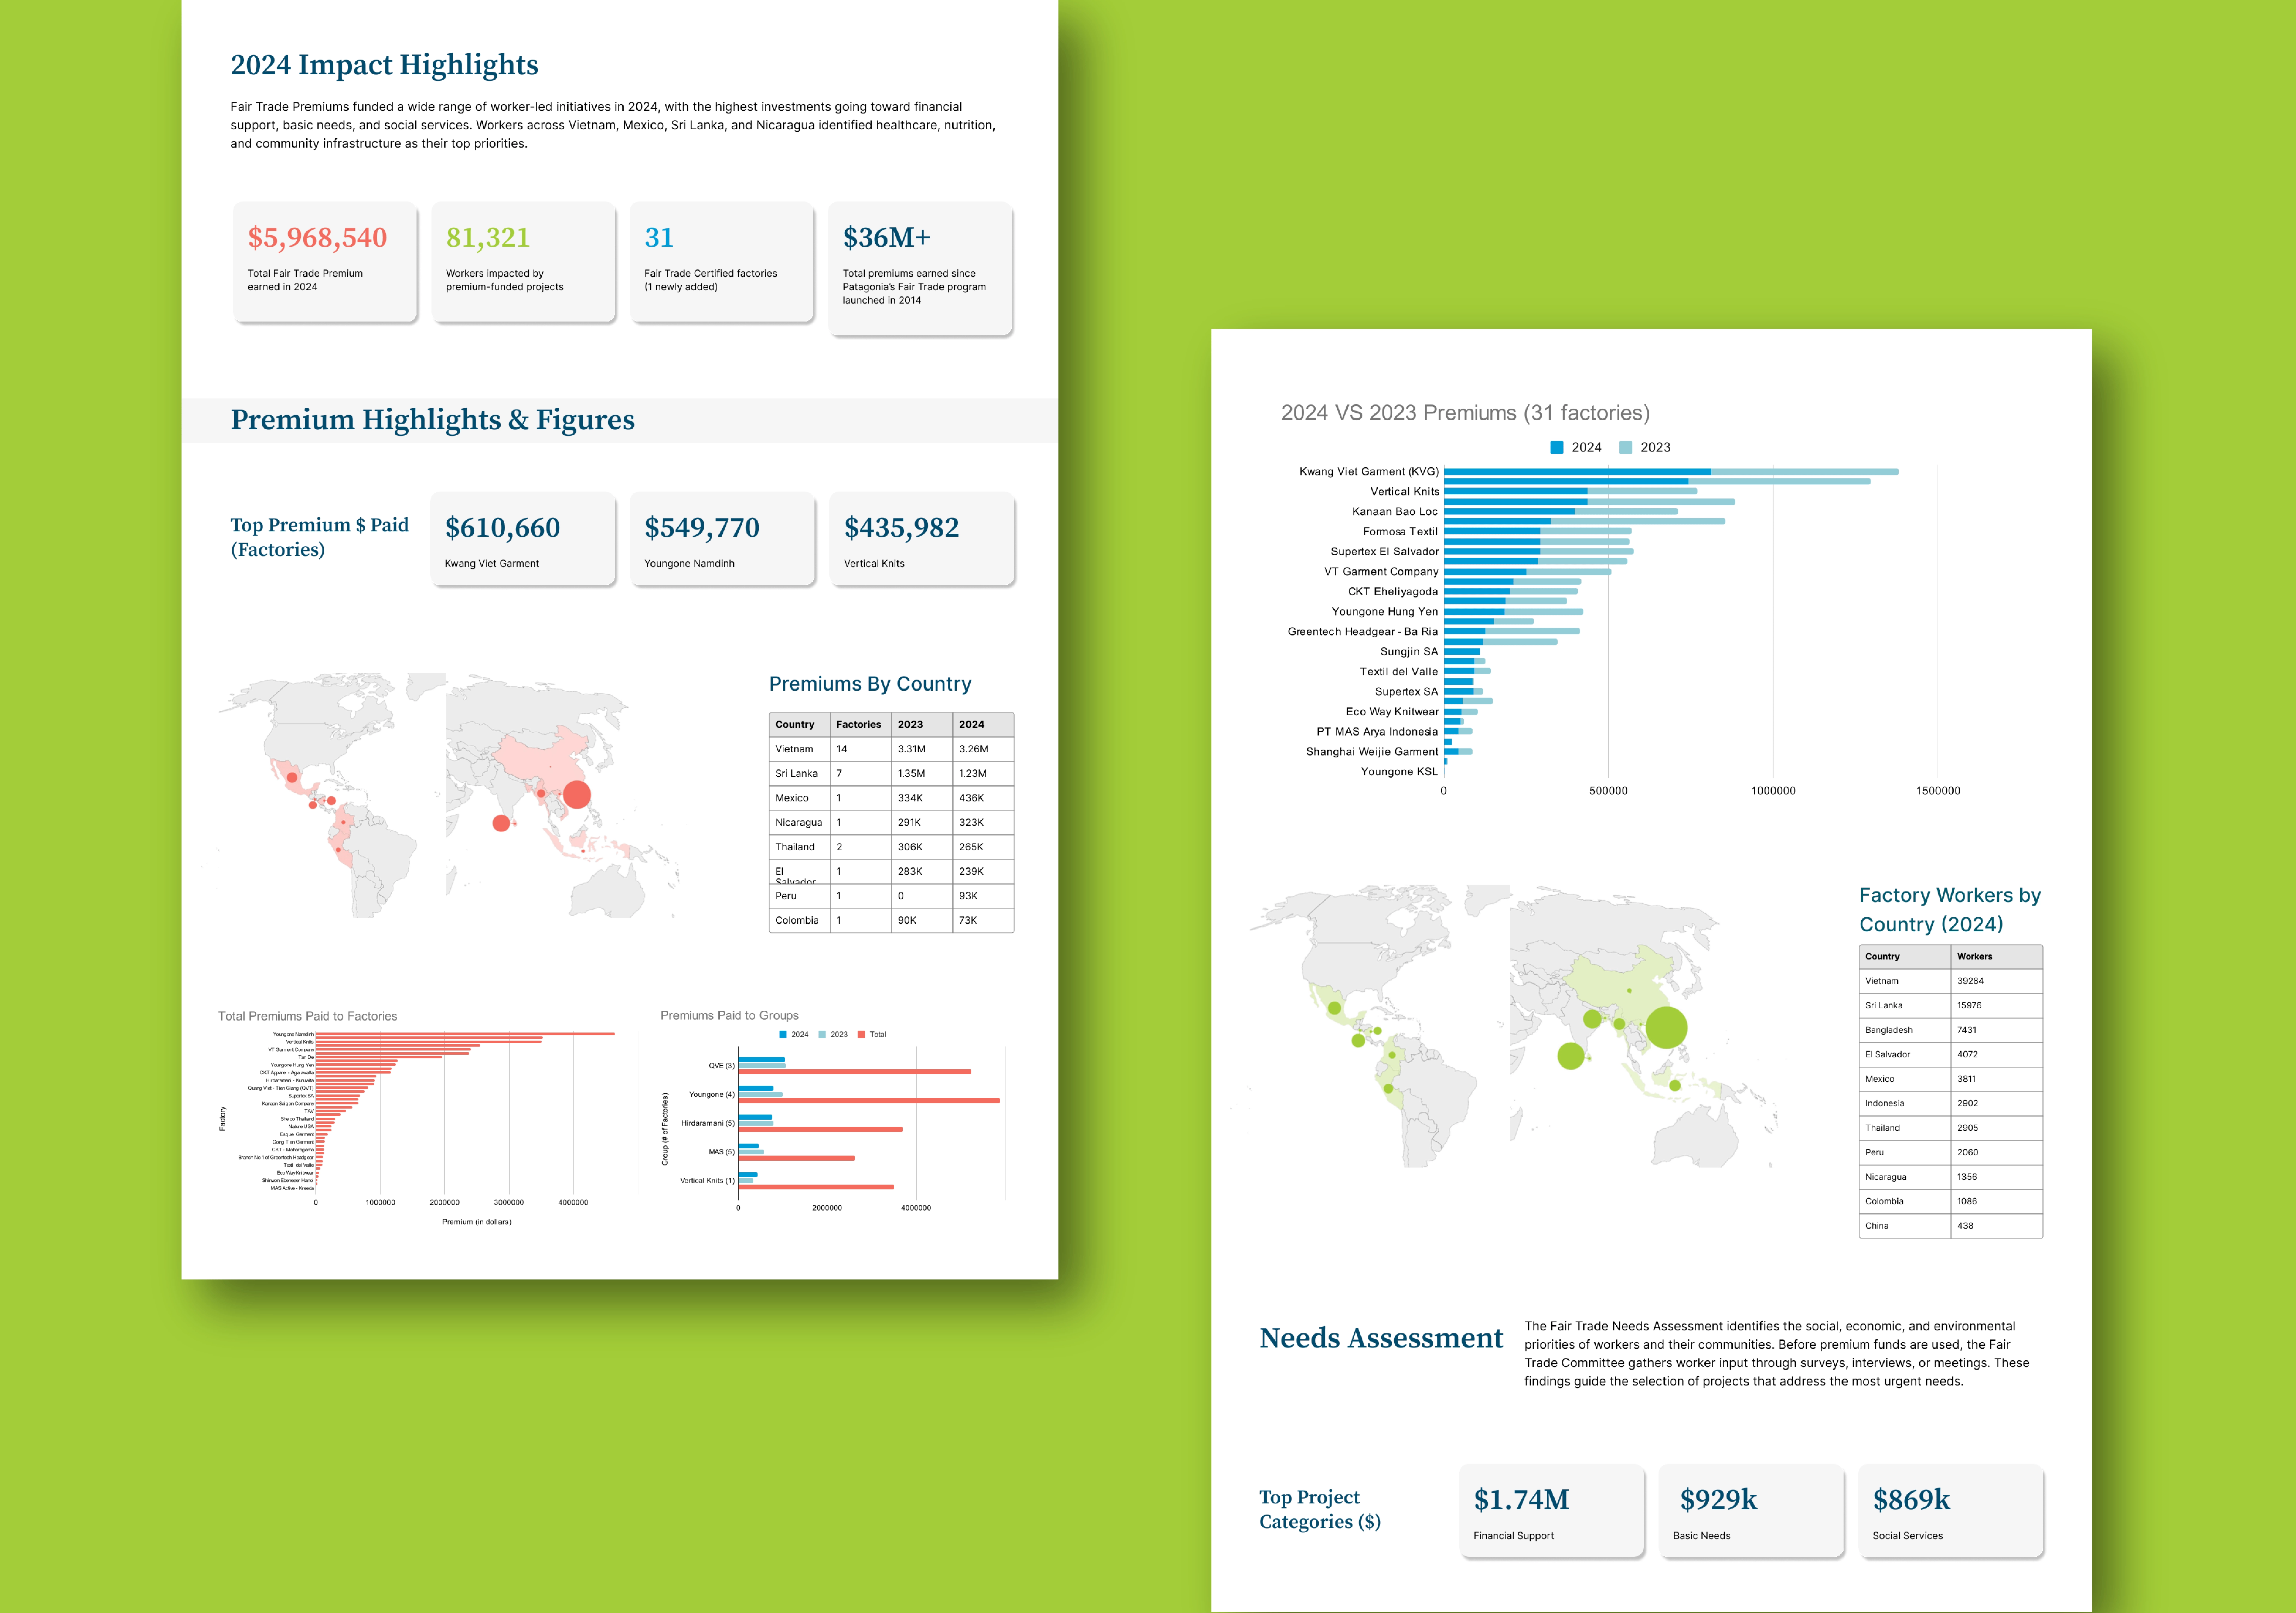
Designed comprehensive web layouts that present impact reports in an engaging, scrollable format with clear sections for mission, key metrics, stories, and supporting data.
Data Visualization & Infographics
Created clear, visually compelling charts, infographics, and data visualizations that make impact metrics immediately understandable and engaging.
Multiple Report Variations
Designed responsive layouts that work across different report structures, allowing the organization to apply the system to annual reports, sector reports, and specialized impact summaries.
Outcome & Learnings
Measurable Impact
Key Takeaways
Transforming impact reports from static PDFs to dynamic web experiences significantly improved stakeholder engagement and impact communication. The scrollable narrative format combined with well-designed data visualizations made complex information accessible and emotionally compelling. The modular approach allowed the organization to apply the system across different report types without starting from scratch each time. This project reinforced the importance of considering information architecture and data visualization as core design disciplines, particularly when communicating mission-driven work where clarity and engagement are critical to stakeholder support.